Thursday, June 6, 2013

Prospective Student Letter Blog Post

June 5, 2013
Dear Prospective Honors Math Analysis Students,

First of I want to say welcome to the 2013-2014 Honors Math Analysis Class, students you have made a great decision in choosing this math class this year. This class is full of communication amongst your peers, work involving technology and is a course of rigorous, but fun work.  Being successful for this class you need to bring out the hardworking, responsible student you have within yourself.  You need to put time and effort into this class as well as in all of your other classes. This class is definitely different from the math classes you have taken previously; it involves 110% more attention in order for you to succeed and understand the class.

Starting with how this classroom is structured, as previously described this class is different compared to the previous math classes taken, it is not your traditional textbook  learning method, in fact we rarely even use our textbook, we use a method called the flipped classroom.  The flipped classroom is where we watch videos at home containing the days lesson and this is the homework you will be responsible to do. Then after watching the lessons you will need to answer WSQ questions which are basically summary questions of what you learned in the video. Now as for watching the video this is beneficial and helpful because you have the power to control the way you want to learn, by this I mean you have the power to stop, pause, and rewind the video if you have trouble understanding the concept. You can go back to the prior videos if you are so confused, need to study, or when there are reviews from past concept on test.  I suggest when watching the videos to not only watch and do the example s, but take notes on the side about the video and the important content it talks about. This will be really helpful when it comes time for finals because you will get to use your packets for them.  The binder is where you will keep all your unit packets, test, quizzes, and extra work that you have done throughout the class, keep it organized because it does count as a grade!! After watching the video work on the Practice Quiz Problems based on the lessons you previously watched.  Practice quiz problems are problems based on the concept that you will have to complete during class after watching the lesson. These will be completed in class and you will have the opportunity to ask Mrs. Kirch or the peers around you for help. If you are lost, definitely ask for help; don’t just expect you to keep moving forward through the Unit without understanding, GET HELP. There will also be daily quizzes to take on the concepts you watched. For the quizzes I recommend you to take them the day after you watch the concept, it would really prevent you from procrastinating on the quizzes. It will also give you time to see your mistakes and study them in order for you to retake the quiz. Now, watching  the videos at home is important because that is the lesson you will be practicing during class, don’t just rush through it to get the WSQ answers, you need to pay close attention because your test, practices quizzes, practice test, extra work and blog post involve the lesson in the video.   Now since you will be using a lot of technology I recommend you to have the videos on a flash drive just as a backup in case the internet fails on you.  Also don’t try to do your blog post last minute because if the internet fails on you that is no excuse because you had time to have the work done.  When doing blog posts if there will be a video involved there is a good chance that you will need to be uploading it to your computer or an internet source in order for the video to be shown on your blog, if the video needs to be uploaded DO NOT just stare at the computer when it is uploading. From previous experience uploading takes some time, so when this occurs go do other work when the video is uploading don’t just stare at the computer and watch it second by second, DO WORK!! Since I mentioned we will be having blog posts don’t panic, yes we will have our own blogs, it is easy to handle.  Setting up the blog will require a Google account, the instructions for it are pretty straight forward, but you need to make sure you set up everything correctly.  On the blog you will be posting up question on the unit, extra work, videos etc. Make sure to make everything appropriate because this is only a MATH BLOG, it is not for your personal use to be posting up your private life ,that’s what Facebook is for. Keep everything organized and neat.

In the beginning of the semester it may be tough with adjusting to having to watch videos every night and combine it with other school work, but you just have to pace yourself. I recommend when you do your summer work to time yourself and see how much time you need in watching the videos and finishing the work required for a night, so you can see the pace that you are at. Throughout the summer you can try to improve the way you do your work and adjust to the new system which can help you get the work done accurately and quickly during school. I am recommending you do this because this is a fast pace class. There will be no time, NO TIME for you to be falling behind. Since this class is based on watching videos at home the pace is different than regular classes. You will also maintain your own blog and having to make your own problems in some occasions. You as a student are your own boss in this class, you need to pace, motivate and get your work done to get to where you need to be in this class. You will be rewarded with doing your best in this class, for example being on the Crazy 8 Club, this is when you  get all scores of 8 on your quizzes, another is being part of the Club 95, this is when you get a 95% or higher on your test. This class can be tough, but yet very rewarding. You will learn songs, chants and receive new ways for preparing for test in this class. Take every aspect of it in and enjoy it!!

Well I wish you guys the best and I’ll leave you with saying be a hardworking student and do your work with integrity.

Good Luck,

J.R


P.S Here is a video explaining key points about the flipped classroom. Hope you enjoy!!

Monday, June 3, 2013

Unit V Big Questions


1. Explain in detail where the formula for the difference quotient comes from now that you know! Include all appropriate terminology(secant line,tangent line, h/delta () X.)

Background The ∆X is the same as H. ∆X=H Wherever ∆X is it is just taking the place of the H. This triangle sign stands for change ∆, when paired with X (∆X) we know it as Delta X. 

Deriving the Difference quotient involves the slope formula and two points that make a tangent and the secant line.

First off in the  graph seen below we see two points on the graph. It shows how the difference quotient variables are seen on a graph. 

- The black point  forms a tangent line. It makes a tangent line because it touches the graph once. This point will be known as our X.
http://www.teacherschoice.com.au/images/derivative_secant_1.gif

 -The picture above demonstrates a  red dot which  is our secant line. The secant line crosses two points, the black and the red dots. This point is labeled as X+ ∆ X(H).  This point is labeled as X + ∆ X(H)  because the distance between the two points are ∆ X(H), therefore we add the ∆X(H) to the X and that is how it becomes  X+ ∆ X(H). 


After we organize our X and Y points to plug into our slope formula. As seen in the picture shown previously the points we will be using are (x(X1),f(x)(Y1),(x+h(X2),f(x+h)(Y2). 
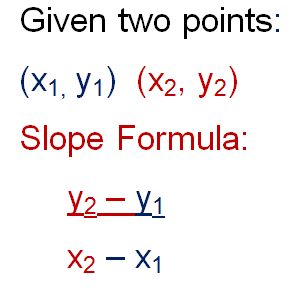
This is where we use the slope formula  to form our difference quotient. The slope formula is Y2-Y1/X2-X1:


http://www.algebra-class.com/image-files/slope-formula-2.gif


As we see in the image  below, in the denominator the X's cancel leaving us with just ∆ X(H). After canceling the 
∆X(H) we are have accomplished deriving the Difference Quotient!!


This video  shows the process visually of how to derive the Difference Quotient. It begins with showing the difference quotient from the graph and moving in the using the slope formula to solve the difference quotient. Hope you enjoy!!


http://www.youtube.com/watch?v=XA0fZh8cXV8

Sunday, May 26, 2013

Unit U Big Questions

Big Question #1. What is continuity? What is discontinuity?


Continuity is when a graph has no breaks, holes, and jumps. The graph goes through from point to point with no disturbance as seen in the images shown below.


http://upload.wikimedia.org/wikipedia/commons/thumb/c/c2/Bisection_method.png/250px-Bisection_method.png  http://www.analyzemath.com/calculus/continuity/continuous_1.gif

Discontinuity is a distinct break in the graph. There are two groups of discontinuity removable discontinuities and non-removable discontinuities.  

Removable discontinuity consists of point discontinuity which is known as a hole. The image below shows an example of point discontinuity, as seen there is a hole in the graph.

http://www.wyzant.com/Images/Help/disc1.gif


There are three types of non- removable discontinuities: jump discontinuity, oscillating behavior, and infinite discontinuity. These are discontinuities because they involve holes in there graphs, wiggly lines and  they have breaks as seen in the pictures below.

http://thetwomeatmeal.files.wordpress.com/2010/11/discontinuities.jpg

Big Question #2 What is a limit? When does a limit exist? When does a limit not exist? What is the difference between a limit and a value?

A limit is the intended height of the function. It is where 2 points meet at the same time on the graph. The way we write the limit is “the limit x approaches a # of f(x) is a # (limit).

http://komplexify.com/math/images/haiku/LimitHaiku1.png

A limit exists when the point reaches the same height of both the right and left side. The limit still exist in a hole because is still has the exact height from the left and right side.
http://www.wyzant.com/Images/Help/limitspic.gif


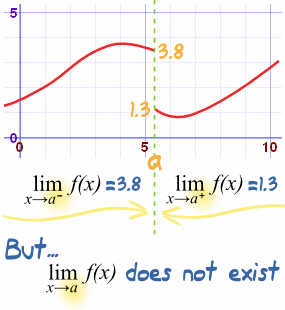
A limit does not exist when there is a break in the graph, this occurs when the left and right sides of the graph don’t meet at the same height. As seen below there is a jump discontinuity and shows that there are two different heights therefore the limit does not exist. For this we need to write a one- sided limit statement. As seen in the picture you place a negative and positive sign beside the number where x approaches.

http://www.mathsisfun.com/calculus/images/discontinuous-function.gif

A limit is the intended height of the graph whereas the value is the actual point of the graph. A limit and value can either be different points for example in this picture we see the limit and value are different. The limit is 5 and the value is 2.

http://00.edu-cdn.com/files/static/mcgrawhillprof/9780071624756/LIMITS_AND_CONTINUITY_PRACTICE_PROBLEMS_15.GIF


In this picture we see that the limit and value occur at the same time. Tracing the graph from the left and right side we can see that the limit and value will be the same. 


Big Question #3. How do we evaluate  limits numerically, graphically and algebraically?

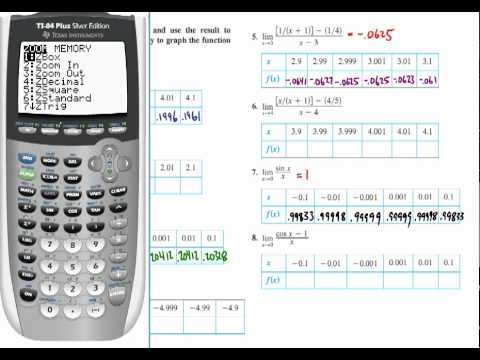
Evaluating the limit numerically we need to use a table. We put in the number that the limit approaches in the middle and on the left (negative) and right (positive) side we put numbers that reach the closest to number. Then we simply plug it into the calculator to find our limit.


Solving it graphically all we need to do is plug in the function to our calculator and graph it. Then we trace the graph from the left and right side to see where the limit falls. The limit can be a whole number or  Does Not Exist.


There are four ways to solve the limit algebraically:

  • The first method is direct substitution. For this method we just plug in the number that x approaches in the equation.  There are four answers can get: a numerical answer, 0/#, #/0 and 0/0 which is an indeterminate form. All the answers are correct to get except 0/0 which is indeterminate.  With getting indeterminate form we have to try a different method. The following methods are what we can use.

  •  Another algebraic method we use is dividing out/factoring method. We use this when we get indeterminate form. We factor out the numerator and denominator then we cancel out the like terms.  After we do this we use direct substitution to solve for the limit.

  • When dealing with problems with rationales and when they are indeterminate we use the rationalizing/conjugate method.  In this method we multiply the numerator and the denominator by the conjugate.  Then we plug in the number as the x approaches  to get our limit.

  • Our last algebraic method is limit at infinity. In this method we divide by the denominator highest power.  The next step is to use direct substitution to get our limit. 


Cited:
http://apcalculusbc.com/wp-content/uploads/2012/08/onesided-limits-2.png
https://encrypted-tbn1.gstatic.com/images?q=tbn:ANd9GcRQwZw2zv-i_fxGu8_H8FuW_mXd7XsZxO3kG5WBGDDgL-L7IFnY
https://blogger.googleusercontent.com/img/b/R29vZ2xl/AVvXsEjDL1cEra4hLWWyun8CrRy57-FE7lAgx0wkWVFVFGu0jamAQinwTiTS3CbERmX7PS9ccebcI32xbCW6fkHwPzOLMkrLHw3-yXKZTdXARx8B_pvmqkXDzZBaCyTG9s9GZsHf3ZzjNqb5Ibpe/s1600/Function+y+%253D+10x.019.png

Thursday, May 2, 2013

Math Mistakes Add.& Sub. Complex Numbers; Link: http://mathmistakes.org/?p=1070


What went wrong?
The mistake that occurred in the first box is that they did not distribute the negative properly. They were also subtracting numbers but then kept the numbers they had subtracted. Another mistake that they did was that in the second box the student foiled the equation when it should have been subtracted.

What they needed to do?
They needed to distribute the negative sign properly and then combine like terms, as shown on the picture below. This problem should not have involved multiplying it involved adding and subtracting only. 


Math Mistakes Sum and Difference;Link: http://mathmistakes.org/?cat=374


What went wrong?
The mistake for all the three boxes are that the student did not use the sum and difference formula to solve the equations. They simply look at the Y or X on the degree ordered pair and add or subtract them to get there answer. This is incorrect...

...What they should have done:
What they needed to do was solve the equations with the sum  and difference formulas. This means each degree being used  is labeled as the U or the V and the ordered pairs are separated into  sin,cos,and tan to make it simpler to imput into the equations, as seen in the pictures below. The highlighted problems are the ones that are shown on the Math Mistakes( each colors corresponds to each equation).


Answer to Question
These responses reveal that the student doesn't understanding trig because he/she is just using the X and Y parts of the degree ordered pair instead of the sum and difference formula. He/She needs to study the formulas and separate each ordered pair in order to successfully solve these problems.


Math Mistakes Special Right Triangles; Link: http://mathmistakes.org/?p=1003


What went wrong?
The mistake was that he rationalized the 1 instead of equaling it to N√2 and solving it out that way. He used the Pythagorean identity  which is a big NO NO when solving this equation.

Correction: What he had to do was equal the 1 to N√2 because that is the corresponding formula for that side. As seen below each side has a corresponding formula, therefore when the correct way was to equal the 1 to N√2 which gives you 1/√2. Next you rationalize and you get the answer of  √2/2.

Comment: 

Using the Pythagorean identity is the wrong formula to use, this type of problem does not use this type of formula. This is not used because each side has a formula. If I were in a situation if I forgot the formulas for the sides, I would probably would have used the Pythagorean identity as well.

Math Mistakes: Combining Like Terms; Link: http://mathmistakes.org/?p=953


What does the picture show?
This picture shows an equation of combining like terms. The equation seen above has been solved wrong  but the words in red go through the correct process.
What the viewer needs to pay close attention to in order to understand the concept?
The viewer needs to pay close attention to what the mistake of the student was. The mistake he made was combining all the terms together even though they weren't alike. They combined the numbers and placed the exponent along with the X. 

Correction: What the student had to do was combine  like terms of the problem which were the numbers with the exponent of x^4(10x^4 & 8x^4). Then they just bring down the 12x^5 to what we had combined and the correct answer would be 12x^5+18x^4.

Comment:

When I looked at the picture I could instantly see the mistake. This problem could be easily solved, but he made a cheeses bucket mistake!!

Wednesday, April 24, 2013

Unit T Big Question #2

How do the graphs of sine and cosine relate to each of the others? Emphasize the asymptotes in your response 
a. tangent
b. cotangent
c. secant
d. cosecant


What is this concept about?
This concept explains how sine and cosine are related to making the graph of the other trig functions. Ratio and reciprocal identities are used in order to understand this concept.

What the viewer needs to pay close attention to in order to understand the concept?
We need to pay close attention to the pattern of the signs in the graph. There is a trick that involves the signs to know whether the drawings on the graphs are correct for cotangent and tangent. For sin and cos the graph will lie in the corresponding ratios place. For example sin will stay with csc and cos will stay with sec.

Sine and Cosine are used to draw the other trig ratio graphs because they use the ratio identities and reciprocal identities to know the asymptotes to draw there graph. 


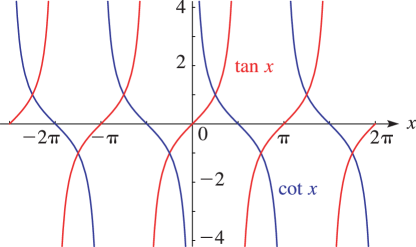
Tangent/Cotangent
The signs we are using are of sine and cosine of each quadrant:
Quadrant 1- Positive ÷ positive =positive
Tan,Cot,Sin,Cos fall in positive.
Quadrant 2- Negative ÷ positive=negative
Sin positive; Cos,Tan,Cot negative 
Quadrant 3- Negative ÷ negative= positive
Sin and Cos negative; Tan and Cot positive
Quadrant 4- Negative ÷positive=negative
Cos positive; Sin negative, Tan and Cot negative
The trick was used above. What it is is that the division we do from sin and cos gives us the sign (positive or negative) in which the  tangent and cotangent lie in.
The picture above shows sin.cos,tan.cot being graphed. You can see the trick visually on the graph. 


CSC/SEC
The reciprocal will lie in the same position to its corresponding trig ratio.
Quadrant 1-
Sin,Cos,Csc,Sec fall in positive
Quadrant 2-
 Sin positive Csc positive; Cos, Sec negative
Quadrant 3-
Sin,Cos,Csc,Sec negative
Quadrant 4-
Cos,Sec positive,Sin, Csc negative


Unit T Big Question#3


Why is a "normal" tangent graph uphill, but a "normal" cotangent graph downhill? Use unit circle ratios to explain.

What is the concept about?
This concept is going to explain how tangent goes uphill and cotangent goes downhill. It will clarify why these two graphs have the different motion yet having the same pattern.

What the viewer needs to pay attention to in order to understand concept?
The viewer needs to pay attention to where the asymptotes are drawn for cotangent and tangent. This determines the way the graph will be shaped. They may have the same pattern, but the graphs are shifted differently when drawing them. We also need to remember the positive and negative pattern because we are going to use it.

Explanation:
There is a difference between the shapes of the graph because of  where the asymptotes are placed for tangent and cotangent. 

Tangent:
The tangent has the ratio identities of sin/cos. Since the asymptote is placed at pi/2 and 3pi/2 the graph is drawn going upward. The pattern is positive and negative, positive and negative. The negative is going upward to the next period which is positive, then the next period starts negative going up to positive. This gives it the uphill motion.


Cotangent:
The cotangent has the ratio identities of cos/sin. This means the asymptote are located in the 0 and pi. The pattern is positive and negative, positive and negative. This period starts at the positive and then goes down to the negative period. Then again it starts at the positive and goes down to the negative period. This gives it the downhill motion. 


Unit T Big Question #4


Why does sin and cosine NOT have asymptotes, but the other four trig graphs do? Use the unit circle ratios to explain?

Asymptote: A line that approaches the given curve but makes no contact with it. 

What is this concept about?
This concept explains why the cosine and sin do not have asymptotes and the other trig ratios do. We will be using ratio reciprocals and ratio identities from Unit Q to explain why trig ratios have asymptotes.

What the viewer needs to pay close attention to in order to understand the concept?
The viewer needs to pay attention to how each distinct place  is undefined on the graph, in other words where the asymptotes are placed when graphing. They also need to pay close attention to whether it is being drawn positive or negative in there period. Pay attention the explanation below on why sine and cosine don't have asymptotes.

Sine/Cosine
Sine does not have an asymptote because the ratio is y/r, R always equals one on the unit circle, therefore it can never be undefined. Same goes with Cosine it's ratio is x/r, the R is always one, so its not undefined. What both of these do have is an amplitude of one which was explained in Big Question #1 part B.

The pictures below explain how ratio identities and reciprocal identities are involved. It as well shows drawings of the asymptotes

Tangent
Tangent has a ratio identities of sin/cos, so whenever cosine equals zero the tangent is undefined leading it to have an asymptote. The asymptote on the graph is located wherever cosine equals 0 on the unit circle, in this case pi/2(90deg.) and 3pi/2(270deg.). 


Cotangent
Cotangent has the ratio identities of cos/sin, so wherever sine equals 0 the cotangent is undefined leading it to have an asymptote. The asymptote is located where the sin equals 0 , in this case at 0(0deg.) and pi(180deg.). 


Secant
Secant is the reciprocal of cosine, this is known from the reciprocal identities sec=1/cos. So similar to tangent whenever cosine equals 0 it is undefined leading it to an asymptote. The asymptote on the graph is located wherever cosine equals 0 on the unit circle, in this case pi/2(90deg.) and 3pi/2(270deg.). 


Cosecant
Cosecant is the reciprocal of sine and we know this by the reciprocal identities of csc=1/sin. Similar to cotangent whenever sin equals zero is where the asymptote is located.  The asymptote is located where the sin equals 0 , in this case at 0(0deg.) and pi(180deg.).  


Unit T Big Question #1

How does the trig graphs relate to the Unit Circle?
A. Period? Why is the period of Cosine 2 pi, whereas the period for tangent and cotangent is pi?


1.      What is this concept about?
This concept is about is understanding why there is a difference among the periods of sine and cosine and tangent.  These pictures will show the relationship the period has with the unit circle.  By doing this we learn the pattern cosine, sine and tangent have on the Unit Circle which helps us with answering our question.

What the viewer needs to pay close attention to in order to understand the concept?
The viewer needs to pay close attention to the relationship among the unit circle and the graph. By this I mean that they are similar because the graph takes the same units on the quadrant angles (0, π/2, π, 3π/2, 2π) and lays them horizontally on the x- axis.  A KEY FACTOR is to know the pattern of each ratio, this helps tremendously with understanding the answer to our question.

PATTERN:


 Sin++--

This picture depicts how the unit circle lies on the X axis with it s units. It is also showing how the patterns go for the whole period from 0 (0 degrees) to 2 pi ( 360 degrees), 1 whole revolution. 
Cos +--+


For the pattern seen above the highlighted area shows the repetition the tangent pattern within the revolution, therefore since it goes half a revolution the period is pi because that is where it starts its repetition


Tan    +-+-


1. B. Amplitude? How does the fact that sine and cosine have amplitudes of one ( and the other trig functions don't have amplitudes) relate to what we know on the Unit Circle? 

Amplitude: Is the" half distance between the highest and lowest point".


         What is this concept about?
This concept is about explaining why sine and cosine have amplitude of 1 whereas the other trig functions don’t. This is going to involve the Unit Circle and its ordered pairs, it contains on the quadrant angles.

What the viewer needs to pay close attention to in order to understand the concept?
Pay close attention to the explanation on how the unit circle and the graph are related. Knowing where the ordered pairs will be located on the graph is very important. As for the other trig ratios they are derived from the cosine and sine ratio identities and reciprocal identities in order to get  the asymptotes. In this case all the trig ratios besides cosine and sine will have asymptotes. 

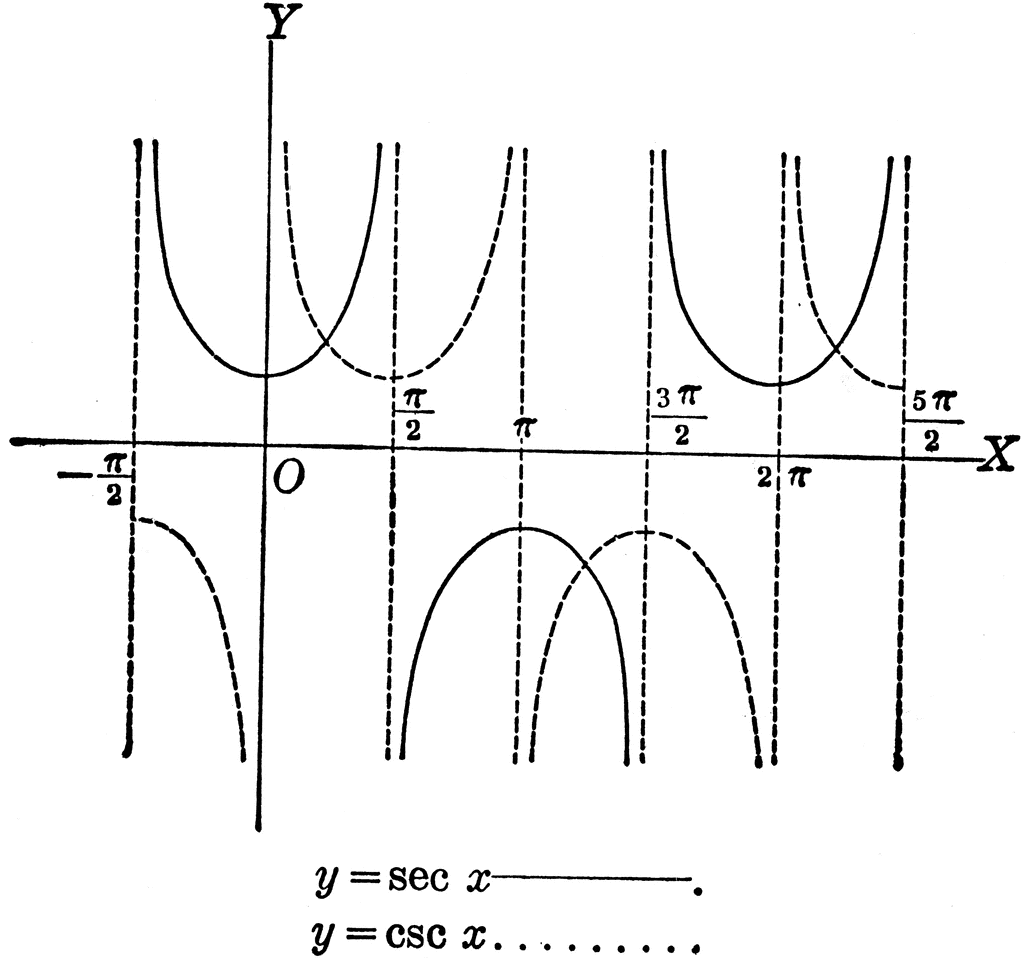
Tangent, Cotangent, Secant and Cosecant don't have an amplitude because they don't have a  highest or a lowest point on there graph, therefore no amplitude can be found.  What they do have is asymptotes, which are explained in Unit T Big Question #4.(Pictures shown below show cosecant and secant graphs)


This image shows the ordered pairs of the quadrant angles  on the unit circle. The highlighted numbers are the ones we will use for labeling the graph.

Here the graph is showing the amplitude of the cosine which is one. In the previous picture
shown it highlighted the numbers we were going to use. The graph has points on 1(0), 0 (pi/2), 1(pi), 0(3pi/2),1(2pi). But we know the amplitude is one because at the ordered pairs  (0,1) ,(pi,-1),(2pi,1) have the amplitude of one.   On the bottom it shows where the line will cross to be at 1, the amplitude. 


Similar to the cosine graph the amplitude of sine is  1. The amplitude is located wherever sine is 1 on the ordered pairs. The sine is one at the 90 degree, which is pi/2 on the graph and at  270 degrees which is 3pi/2 on the graph. With knowing this the graph will have a point on (pi/2,1) which gives it the amplitude of one. An the other point is (3pi/2,-1) which has the amplitude of one as well. The bottom shows where the line will cross the one.


Cite:

Unit T SSS Packet
www.googleimages.com


Monday, April 15, 2013

Assessment # 3; #1 Unit S Concept 3


What  is the video about?
This is Assessment #3 Unit S Concept 3 being shown. This problem goes over #1 on the SSS packet, it explains power reducing formulas.  

What the viewer needs to pay close attention to in order to understand the concept?
What the viewer needs to pay close attention to is is what power reducing formulas we will be using in order to solve the problem. The main, very important  concept is that we need to remember our goal is to get the equation to the highest power of one. Another important key the viewer can pay close attention to is using the tactic from Unit Concept 4, with using the M; pay closes attention to how this is explained because it can be tricky. 

Assessment #2; Comparing Half- Angle & Sum/Difference


We know the answers are the same on both because we confirm it with our calculator. We plug each equation into our calculator and we should get a decimal point. Then we enter the 105 degrees with sine, cosine, and tangent and receive and equivalent decimal from the ones in the  equation. What I got for this particular equation is : Cosine= -.258, Sine= .965, Tangent= -3.732.Thank You for viewing!!