Big Question #1. What is continuity? What is discontinuity?
Continuity is when a graph has no breaks, holes, and jumps.
The graph goes through from point to point with no disturbance as seen in the images shown below.
 |
http://upload.wikimedia.org/wikipedia/commons/thumb/c/c2/Bisection_method.png/250px-Bisection_method.png http://www.analyzemath.com/calculus/continuity/continuous_1.gif
Discontinuity is a distinct break in the graph. There are
two groups of discontinuity removable discontinuities and non-removable
discontinuities.
Removable discontinuity
consists of point discontinuity which is known as a hole. The image below shows an example of point discontinuity, as seen there is a hole in the graph.
 |
| http://www.wyzant.com/Images/Help/disc1.gif |
There are three types of non- removable discontinuities:
jump discontinuity, oscillating behavior, and infinite discontinuity. These are
discontinuities because they involve holes in there graphs, wiggly lines and they have breaks
as seen in the pictures below.
| http://thetwomeatmeal.files.wordpress.com/2010/11/discontinuities.jpg |
Big Question #2 What is a limit? When does a limit exist? When does a limit not exist? What is the difference between a limit and a value?
A limit is the intended height of the function. It is where 2
points meet at the same time on the graph. The way we write the limit is “the
limit x approaches a # of f(x) is a # (limit).
 |
| http://komplexify.com/math/images/haiku/LimitHaiku1.png |
A limit exists when the point reaches the same height of
both the right and left side. The limit still exist in a hole because is still
has the exact height from the left and right side.
| http://www.wyzant.com/Images/Help/limitspic.gif |
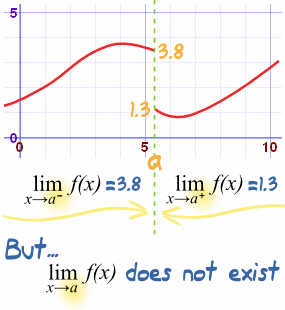
A limit does not exist when there is a break in the graph,
this occurs when the left and right sides of the graph don’t meet at the same
height. As seen below there is a jump discontinuity and shows that there are two different heights therefore the limit does not exist. For this we need to write a one- sided limit statement. As seen in the picture you place a negative and positive sign beside the number where x approaches.
 |
| http://www.mathsisfun.com/calculus/images/discontinuous-function.gif |
A limit is the intended height of the graph whereas the
value is the actual point of the graph. A limit and value can either be
different points for example in this picture we see the limit and value are
different. The limit is 5 and the value is 2.
 |
| http://00.edu-cdn.com/files/static/mcgrawhillprof/9780071624756/LIMITS_AND_CONTINUITY_PRACTICE_PROBLEMS_15.GIF
In this picture we see that the limit and value occur at the same time. Tracing the graph from the left and right side we can see that the limit and value will be the same.

Big Question #3. How do we evaluate limits numerically, graphically and algebraically?
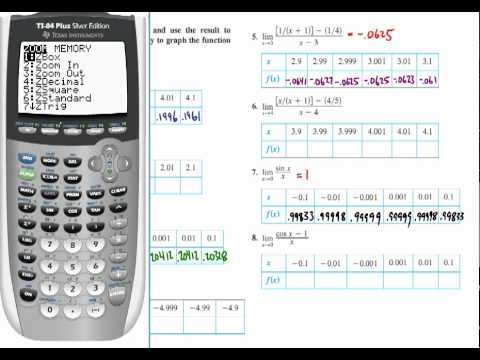
Evaluating the limit numerically we need to use a table. We
put in the number that the limit approaches in the middle and on the left (negative)
and right (positive) side we put numbers that reach the closest to number. Then
we simply plug it into the calculator to find our limit.
Solving it graphically all we need to do is plug in the
function to our calculator and graph it. Then we trace the graph from the left
and right side to see where the limit falls. The limit can be a whole number or Does Not Exist.

There are four ways to solve the limit algebraically:
Cited:
http://apcalculusbc.com/wp-content/uploads/2012/08/onesided-limits-2.png
https://encrypted-tbn1.gstatic.com/images?q=tbn:ANd9GcRQwZw2zv-i_fxGu8_H8FuW_mXd7XsZxO3kG5WBGDDgL-L7IFnY
https://blogger.googleusercontent.com/img/b/R29vZ2xl/AVvXsEjDL1cEra4hLWWyun8CrRy57-FE7lAgx0wkWVFVFGu0jamAQinwTiTS3CbERmX7PS9ccebcI32xbCW6fkHwPzOLMkrLHw3-yXKZTdXARx8B_pvmqkXDzZBaCyTG9s9GZsHf3ZzjNqb5Ibpe/s1600/Function+y+%253D+10x.019.png
|


