Create your own Playlist on MentorMob!
Tuesday, December 11, 2012

Sunday, December 9, 2012
Wednesday, November 28, 2012
Tuesday, November 27, 2012
Student Problem #7

What is this picture about?
This picture portrays an equation from Unit K Concept 10. It shows the repeating decimal being turned to a rational fraction. it as well has notes in the sides, which are important, that you can follow along to understand. Another thing is this equation has a whole number with it, but we'll talk more about it in the second paragraph.
What does the viewer need to pay special attention to in order to understand the concept?
The viewer needs to pay attention to this equation because a whole number is involved. We have to remember to ignore it for the first part, but don't forget about it. First we have to separate into repeating units to make it into a pattern, then go on finding you A1 and ratio. Remember thought A1 and the ratio have to be in a fraction. Now in the end of the problem we need to remember to add the whole number to the sum you got, DON'T FORGET. Read the side notes for step by step help.Overall thank you for viewing this picture.
Sunday, November 25, 2012


Monday, November 12, 2012
Sunday, November 4, 2012
Student Problem #6: Unit J Concept 6


What is this picture about?
This picture shows Unit J Concept 6, Partial Fraction decomposition with Repeated Factors. This picture will demonstrate each step in solving PFD's, a distinction though is that in Concept 5 we solved with distinct factors. Since it is repeated factors we need to remember to COUNT UP the powers. This shows the breaking apart of a fraction approximately in 7 steps. This picture is a well a preview of what we will learn in Calculus.
What does the viewer need to pay special attention to in order to understand the concept?
The viewer needs to pay attention to the side notes in green to show what is being solved. It will as well make each step being easier and more clearer to understand. Since we are dealing with repeated factors we need to remember to COUNT UP the powers correctly. Look closely at this example because it involves a cubic power. For the answer in the end if it happens to be a fraction we need to put the original denominator into the denominator's answer, just like in concept 5. All in all Thank You for taking the time to view the picture.
Student Problem #5: Unit J Concept 5


What is this picture about?
This picture shows Unit J Concept 5, Partial Fraction decomposition with Distinct Factors. This picture will demonstrate each step in solving PFD's. It shows the breaking apart of a fraction approximately in 7 steps. This picture is a well a preview of what we will learn in Calculus.
The viewer needs to pay close attention to the side notes (in green) in order to understand what is being solved. The notes make each step clearer and easier to understand. Also pay close attention to the Distribution Process because that is where many students make mistakes. They will either distribute incorrectly or not put correct signs. When getting your A B or C if you get a fraction be sure to write it correctly in your final answer; you need to place the denominator of the original fraction in the denominator portion of the answer. All in all Thank You for taking the time to look at my pictures.
Tuesday, October 16, 2012
Student Problem #4 Unit I Concept 2

Student Problem #4
- What is this picture about?
- What does the viewer need to pay special attention to in order to understand the concept?
Monday, October 15, 2012
Unit I Concept1 Student Problem #3

Student Problem #3
- What is this picture about?
- What does the viewer need to pay special attention to in order to understand the concept?
Tuesday, October 9, 2012
Jessica and Diana's Student Video 3
Unit H Concept 7
- What is this video about?
- What does the viewer need to pay special attention to in order to understand the concept?
Viewers pay close attention in knowing what to do in a situation where the numbers have no factors of the clues. In the video it clearly states on how to solve problems like these. Also pay close attention to what letter value goes with each log , so you write that answer correctly. Finally another crucial step to listen to is the SIGNS!!! Remember product is addition and dividing is subtraction. Enjoy!!
Wednesday, October 3, 2012
Student Video #2 Unit G Concept 1-7
- What is this video about?
- What does the viewer need to pay special attention to in order to understand the concept?
Friday, September 28, 2012
Unit G Summary Question #10 Range of Rational Functions
10. While the domain of a rational function depends on DIVAH, what do you think the range of a rational function depends on? Give an example.

The range is quite different than the DIVAH because it depends on a different axis. The range of a rational function depends on the horizantal asymptote because it uses the y- values that are above and below the. Just like DIVAH uses the x- values the range of a rational function uses the y- values. For example if you have a vertical asymptote with x=-1 and x=2 the domain would be the + and the - vertically, NOT HORIZONTALLY. The points would be written as (2,2),(2,4),(-1,2),(-1,6).
Wednesday, September 26, 2012
Unit G Summary Questions #6 Finding Holes
6.How do we find the appropriate place to plot a hole if the y- values is undefined when plugged into the original equation?

Note: Not all equations will have holes.
To get a hole the factors of your verticle asymptote must cancel. The canceled portion is what becomes your holes. Now to get your missing y- value you have to plug in your hole to the simplified factored equation. We have to remember to plug it into the simplified one, Not Your Original Equation. After all this process you plot your point as an OPEN CIRCLE on the graph. The rest of our points on the graph will be closed circles.
Note: Not all equations will have holes.
To get a hole the factors of your verticle asymptote must cancel. The canceled portion is what becomes your holes. Now to get your missing y- value you have to plug in your hole to the simplified factored equation. We have to remember to plug it into the simplified one, Not Your Original Equation. After all this process you plot your point as an OPEN CIRCLE on the graph. The rest of our points on the graph will be closed circles.
Unit G Summary Questions #5 Graphs Crossing Asymptotes
5. Describe the conditions in which a graph can cross through an asymptote?
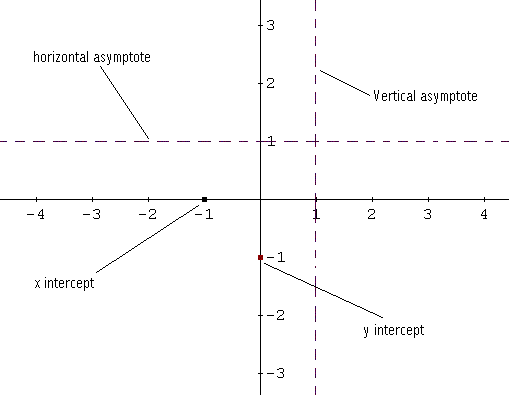 A graph can cross the asymptotic on certain occasions. For the horizontal asymptote the graph can cross in the middle. Now we have to remember that it only crosses the middle NOT THE LEFT OR RIGHT. Secondly a graph can cross the slant asymptote only in the middle. This is similar to the horizontal asymptote because the graph can only cross the middle for both. One that contrast to the concept of the graph crossing in the middle is the verticle asymptote, for this one the graph CAN NOT cross it at all!!
Tuesday, September 25, 2012
STUDENT VIDEO #1: Unit F Concept 10
- What is this video about?
- What does the viewer need to pay special attention to in order to understand the concept?
Unit G Summary Questions #9 X- intercepts
9. Describe how to find the y- intercept of a rational function? Include both the long way and the shortcut way,explaining why the shortcut makes mathematical sense.

For the x- intercept you need to equal your equation to 0. You equal both the numerator and the denominator to zero. Then you either have to add or subtract it to zero to get your answer. If you have a number with a variable after you added and subtracted you need to divide it, then you get your answer. Now what I just explain would be considered the long way. The shortcut is that you just equal the numerator to zero and don't even bother touching the denominator because in reality you don't need it. You would solve the shortcut way similar to the long way just without the denominator portion.
Unit G summary Question #8 Y intercept
8. How do you find the y- intercept of a rational function? Does this need to be done in the original or simplfied equation?
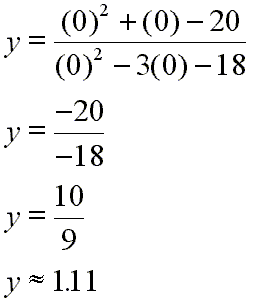 The y- intercept of a rational function is found by plugging in a zero to the equations. You have to plug in the zero to two equations, the equations are the numerator and the denominator. After you plug in the zeroes to your equation you get your numerator and denominator answer in fraction form. If you can divide the fraction evenly then go ahead and if not, leave it as a fraction. For example if you get 3/3 after you plugged in your zeroes it would divide evenly leaving leaving you with the answer of one. For the fraction if you get your answer as 2/9 your y- intercept will just stay as 2/9. The equation can either be the original form or simplified, but preferably I think the original form is easier to solve.
Unit G Summary Question # 7 Limit Notation of Verticle Asymptote
7. Describe how to write limit notation for verticle asymptote and what the notation means?
 The limit notation for a verticle asymptote is similar to the one we have been using for a regular limit notations. The only change is that for the verticle asymptote notation there is an addition of a positive and a negative sign before the f(x). The notation is As X-->#value +,f(x)--> ∞ or -∞ and As X--> # value -, f(x)-->∞ or -∞. The positive sign just stands for the right or the positive x axis side of the graph. The negative sign stands for the left or negative x axis side of the graph.

Monday, September 24, 2012
Unit G Summary Questions # 4 Verticle Asymptotes vs. Holes
What is the difference between a graph having a verticle asymptote and a graph having a hole?
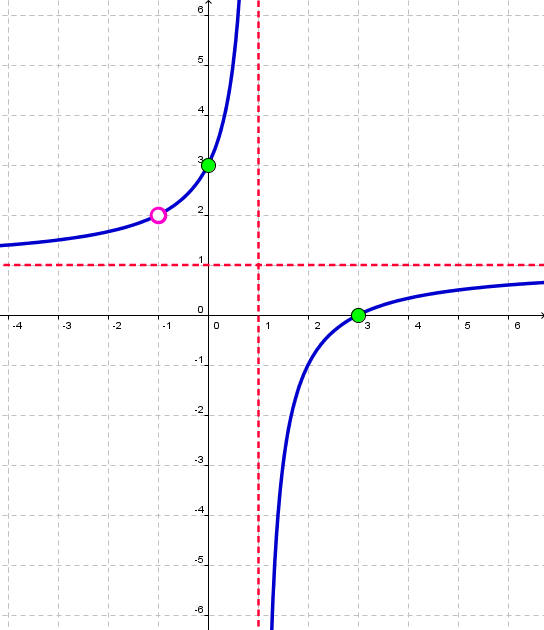 The main difference in a graph having a verticle asympotote and one having a hole is that ones factors cancel and the other ones don't. For example in a verticle asymptote you must factor both the top (numerator) and the bottom (denominator). Then after factoring them you have to see if the factors cancel, if they do it becomes a hole. Now if it factors don't cancel it will just be a verticle asymptote, meaning without holes. Another difference is that having holes will just mean more points other than the three you need on the graph.
Unit G Summary Questions #1 Horizontal Asymptotes
1. How do we know if a graph has a horizontal asymptote? What are the three options?
 A horizontal asymptote goes across the graph horzantally. This is one way in knowing, but there are 3 main ways in telling if it's a horizontal asymptote. The three main ways are based on the degree. First, if the degree is bigger on the bottom (the numerator) then the asymptote is y=0. The next is if it's the same degree (both numerator and denominator) it's the ratio of the coefficients and the third way is if there is a bigger degree on top their is no horizantal slope.
Sunday, September 23, 2012
Unit G Summary Question #3 Slant Asymptote
3. When does a graph have a slant asymptote? How do you find the equation of the slant asymptote?
 Graphing the slant asymptote is based on the degrees of the problem. A graph has a slant asymptote when the degree on the top (the numerator) is one bigger than the degree on bottom (the deniminator). Now this is ONLY when it is one degree bigger not two or three degrees. Now for finding the equation of the slant asymptote you perform long division. We have to remember though the remainder is excluded from the equation.
Unit G Summary Question # 2 Limit Notation of Horizontal Asymptotes
2. Describe what limit notation for horizontal asymptotes actually means.
 When trying to find the limit notation of a horizontal asymptote we need to first know where it touches on the graph. The Horizontal Slope can touch the graph in the middle, but not way to the left or way to the right. This way to the left and way to the right are represented in the limit notation. The limit notation is As x--> +∞, f(x)-->#value and As x--> -∞, f(x) --> # value. These notations mean that the graph can go to the right, which is the positive notation, and it can go to the left, which is the negative notation.

Subscribe to:
Posts (Atom)